What is a Phase Diagram ?
A phase diagram in physical chemistry, engineering, mineralogy, and materials science is a type of chart used to show conditions at which thermodynamically distinct phases can occur at equilibrium. In mathematics and physics, “phase diagram” is used with a different meaning : a synonym for a phase space.
At its simplest, a phase can be just another term for solid, liquid or gas. If you have some ice floating in water, you have a solid phase present and a liquid phase. If there is air above the mixture, then that is another phase. But the term can be used more generally than this. For example, oil floating on water also consists of two phases - in this case, two liquid phases. If the oil and water are contained in a bucket, then the solid bucket is yet another phase. In fact, there might be more than one solid phase if the handle is attached separately to the bucket rather than moulded as a part of the bucket.
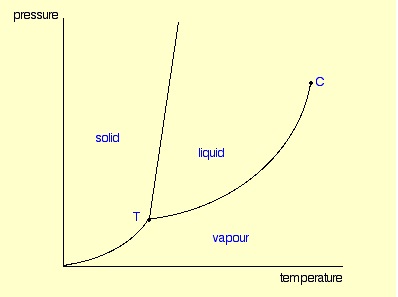 A phase diagram lets you work out exactly what phases are present at any given temperature and pressure. In the cases we’ll be looking at on this page, the phases will simply be the solid, liquid or vapour (gas) states of a pure substance.
These diagrams (including this one) are nearly always drawn highly distorted in order to see what is going on more easily. There are usually two major distortions. We’ll discuss these when they become relevant.
If you look at the diagram, you will see that there are three lines, three areas marked “solid”, “liquid” and “vapour”, and two special points marked “C” and “T”.
You can recognise the presence of the different phases because there is an obvious boundary between them - a boundary between the solid ice and the liquid water, for example, or the boundary between the two liquids. Common components of a phase diagram are lines of equilibrium or phase boundaries, which refer to lines that mark conditions under which multiple phases can coexist at equilibrium. Phase transitions occur along lines of equilibrium.
The three areas
These are easy! Suppose you have a pure substance at three different sets of conditions of temperature and pressure corresponding to 1, 2 and 3 in the next diagram.
Under the set of conditions at 1 in the diagram, the substance would be a solid because it falls into that area of the phase diagram. At 2, it would be a liquid; and at 3, it would be a vapour (a gas).
Moving from solid to liquid by changing the temperature :
Suppose you had a solid and increased the temperature while keeping the pressure constant - as shown in the next diagram. As the temperature increases to the point where it crosses the line, the solid will turn to liquid. In other words, it melts.
If you repeated this at a higher fixed pressure, the melting temperature would be higher because the line between the solid and liquid areas slopes slightly forward.
So what actually is this line separating the solid and liquid areas of the diagram? It simply shows the effect of pressure on melting point. Anywhere on this line, there is an equilibrium between solid and liquid.
You can apply Le Chatelier’s Principle to this equilibrium just as if it was a chemical equilibrium. If you increase the pressure, the equilibrium will move in such a way as to counter the change you have just made. If it converted from liquid to solid, the pressure would tend to decrease again because the solid takes up slightly less space for most substances.
That means that increasing the pressure on the equilibrium mixture of solid and liquid at its original melting point will convert the mixture back into the solid again. In other words, it will no longer melt at this temperature. To make it melt at this higher pressure, you will have to increase the temperature a bit. Raising the pressure raises the melting point of most solids. That’s why the melting point line slopes forward for most substances.
Moving from solid to liquid by changing the pressure :
You can also play around with this by looking at what happens if you decrease the pressure on a solid at constant temperature.
Moving from liquid to vapour :
In the same sort of way, you can do this either by changing the temperature or the pressure.
The liquid will change to a vapour - it boils - when it crosses the boundary line between the two areas. If it is temperature that you are varying, you can easily read off the boiling temperature from the phase diagram. In the diagram above, it is the temperature where the red arrow crosses the boundary line. So, again, what is the significance of this line separating the two areas? Anywhere along this line, there will be an equilibrium between the liquid and the vapour. The line is most easily seen as the effect of pressure on the boiling point of the liquid. As the pressure increases, so the boiling point increases.
The critical point
You will have noticed that this liquid-vapour equilibrium curve has a top limit that I have labelled as C in the phase diagram. This is known as the critical point.
The temperature and pressure corresponding to this are known as the critical temperature and critical pressure. If you increase the pressure on a gas (vapour) at a temperature lower than the critical temperature, you will eventually cross the liquid-vapour equilibrium line and the vapour will condense to give a liquid.
You might also like
| Study Iron-Carbon (Fe-C) Phase Diagram Iron Carbon Phase Diagram A study of the... | Phase Diagrams Fe-Mn, Fe-Co, Fe-Mo Phase Diagram of Fe-Mn, Fe-Co, Fe-Mo - a... | Phase Diagram of Steel - Problem Solving Problem Solving at Steel Phase Diagram Iron-carbon... | Iron Carbon Phase Diagram - Fe-Fe3C and T-T-T Diagram Iron Carbon Phase Diagram Iron-carbon... |
 Alloy Suppliers
 Aluminum
 Aluminum Extrusions
 Copper-Brass-Bronze
 Nickel
 Magnets
 Stainless Steel
 Stainless Steel Tubing
 Steel Service Centers
 Titanium
 Tungsten
 Wire Rope